This page exists because almost everything written about a potential Mullaperiyar failure blends real hydraulic modeling with unverifiable viral claims, without telling you which is which. Here, they're kept strictly separate.
The only real hydraulic model
Exactly one dedicated, site-specific hydraulic dam-break study of Mullaperiyar has ever been conducted: a three-volume 2012 HEC-RAS study by IIT Roorkee, commissioned under the Supreme Court's Empowered Committee process. It modeled seven cascading scenarios across six downstream structures, with each dam given its own breach parameters, simulated as actually failing, not just absorbing the wave.
The "45 minutes to Idukki" figure traces to a 2011 magazine quote from a KSEB engineer, given explicitly because no hydraulic study existed yet. When the real study was finished months later, its own number was 128 minutes, nearly three times longer, and directly contradicting the more dramatic figure still repeated across Kerala public discourse today. The model's other arrival times along the same 36 km reach: 18 minutes at the dam site itself, 26 minutes at Vallakkadavu, 31 minutes at Vandiperiyar. The flow stays channel-confined, under 300 m wide, for the first 30 km, meaning the wave is extremely violent but geographically narrow in this initial stretch, not yet the broad inundation people often picture.
Individually, breaching Idukki Arch alone would produce a peak of 297,327 cumecs; Cheruthoni alone, 345,466 cumecs, meaning even a single downstream dam failing roughly triples the flood on its own, before the combined 552,179-cumec figure is reached. A further, less-discussed volume of the same study modeled the cascade continuing past Idukki to Lower Periyar and the coast, with depths as high as 163.78 m just below a breached Lower Periyar Dam, tapering to 5.43 m near the Arabian Sea.
Crucially, the IIT Roorkee study contains no population or casualty modeling of any kind. It is purely hydraulic: discharge, depth, velocity, arrival time. Every "millions at risk" or "X deaths" figure discussed anywhere in this dispute comes from an entirely separate, non-technical source. The study's own results were also fought over for years and formally denied under India's Right to Information Act before appearing via an independent archive, a real transparency problem, independent of the study's technical quality.
The cascading-failure question
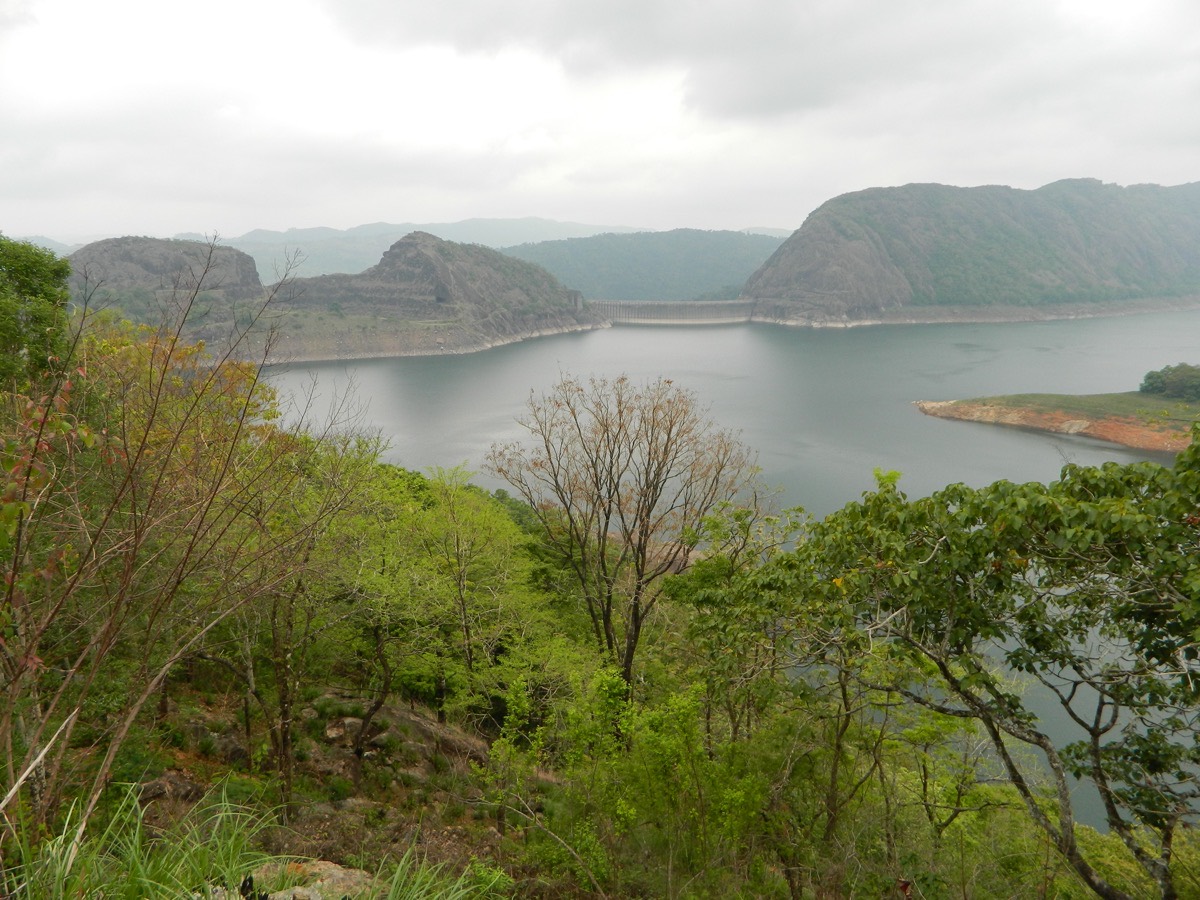
The real danger in a "cascading failure" scenario isn't just Mullaperiyar's water passing through the downstream Idukki reservoir complex. It's that water potentially triggering release of Idukki's own much larger reservoir (roughly 4.5× Mullaperiyar's storage). That's the technical reason the modeled peak discharge jumps sixfold if Idukki and Cheruthoni also fail. Whether Idukki would actually breach in a real event depends heavily on its own reservoir level at the time, which the public model doesn't specify.
The Idukki complex, roughly 35 km downstream, is itself three separate dams enclosing one 60 km² reservoir: Idukki Arch (168.9 m, one of Asia's highest arch dams, with no spillway gates of its own), Cheruthoni (138.2 m gravity dam, the complex's sole flood-release point via 7 gates), and Kulamavu (100 m composite dam, also gateless). Because Idukki Arch has no gates, any emergency release for the whole complex has to happen through Cheruthoni alone, a structural bottleneck worth understanding before assuming the complex could simply "let water through" in a crisis.
Population at risk vs. predicted deaths
These are not the same number, and conflating them is the single biggest source of misinformation in this dispute. "Population at risk" is a precautionary planning figure, everyone who could conceivably be in a hazard zone. A "predicted death toll" requires modeling warning time, evacuation, time of day, and flood depth at each location, a categorically harder calculation that no located Mullaperiyar study actually performs.
| Figure | Source |
|---|---|
| ~50,000–70,000 | Directly between the dam and Idukki reservoir (independent estimate) |
| ~3.5 million ("35 lakh") | UNU-INWEH 2021 report; most commonly cited figure |
| 50 lakh (5 million) | Kerala's own working figure in Supreme Court submissions |
| ~10 million | Save Kerala Brigade NGO petition (2025), the highest figure found |
There is exactly one specific death-toll claim in wide circulation: "35 lakh (3.5 million) deaths," from a 2014 report by Prof. T. Shivaji Rao. This project spent three separate research passes trying to locate and verify the original document, and eventually found it. What it actually shows is a real methodological weakness: Rao's model used the U.S. NWS-DAMBRK software, but substituted Google Earth satellite imagery for real topographic survey data, citing a lack of detailed basin surveys. That's a concrete, citable reason to discount the figure, not just an unverified rumor. Tellingly, 3.5 million is also the most-cited population-at-risk number elsewhere, strongly suggesting the "deaths" claim is a conflation of exposure with mortality rather than an independent finding.
Would it be the biggest disaster in world history?
No, not as an immediate death toll, on any credible reading of the historical record.
- No dam failure in recorded history has ever exceeded roughly 240,000 deaths (Banqiao, China, 1975, the deadliest ever, requiring ~62 simultaneous cascading dam failures, 10+ million people exposed, and a multi-year government information blackout). India's own deadliest dam disaster, for comparison, is the Machchhu Dam-II failure at Morbi, Gujarat, the same year: official figures put the toll around 1,800–2,000, independent estimates run 5,000–10,000+, and it's the direct historical reason the 1979 Mullaperiyar leak scare (see Safety) caused the public panic it did.
- No single sudden-onset disaster of any kind, flood, earthquake, tsunami, has a well-documented same-day death toll above roughly a few hundred thousand.
- The "35 lakh deaths" figure would exceed the deadliest dam disaster ever recorded by 15–20×, in a single event lasting hours. It has no historical precedent.
- In absolute exposure terms, Mullaperiyar isn't even unusually large: its highest cited population-at-risk figure (10 million) is comparable to Banqiao's exposed population (~10.15 million), and both are dwarfed by the tens of millions exposed in history's worst river floods.
What would actually make a Mullaperiyar failure historically exceptional isn't the number of people nearby. It's if something close to all of them died, which would require a near-total failure of warning and evacuation with no real precedent even in history's worst dam disasters.
Economic & environmental stakes
No public study puts a rupee figure on a Mullaperiyar failure specifically, since the actual HEC-RAS results that would support that modeling were the ones denied under RTI. The closest real benchmark: the 2018 Kerala floods (not a dam failure, but the closest comparable regional event) caused an estimated ₹40,000 crore in statewide damage and shut Cochin International Airport for 15–16 days. A dam-break wave, releasing the reservoir essentially at once rather than over days of rainfall, would concentrate comparable or greater force into a far narrower window. The modeled corridor passes through Kumily, Neriamangalam, Kothamangalam, Perumbavoor, Kalady and Aluva before reaching Kochi. Aluva in particular sits on a major railway junction and is the northern terminus of Kochi Metro, adding rail infrastructure to the exposure picture alongside the airport.
The sharpest specific risk in the whole scenario: the Eloor-Edayar industrial belt, roughly 25% of Kerala's entire industrial capacity in a 5 km stretch, including Hindustan Insecticides Limited, a historic DDT-manufacturing plant, and Indian Rare Earths Limited, which processes thorium-bearing rare-earth sand. The area was declared a "toxic hotspot" by Greenpeace in 2003. A flood surge here wouldn't just be a water disaster. It would remobilize decades of accumulated contaminated sediment into the Kochi metro area and the Vembanad Ramsar wetland.
Emergency preparedness
Mullaperiyar is not on Kerala's own disaster management authority's (KSDMA) list of monitored dams, because Tamil Nadu operates it. No confirmed, published, Mullaperiyar-specific Emergency Action Plan exists despite the 2021 Dam Safety Act mandating one. No Mullaperiyar-specific mock evacuation drill has been documented. This, not an unverified casualty number, is the most concrete, checkable gap in the entire dispute.
What real evacuation practice does exist comes from routine, controlled shutter openings: in October 2021, Tamil Nadu gave roughly 24 hours' notice, and Kerala moved 339–859 families in a phased evacuation. That shows the process works at small scale for slow, scheduled releases. It says nothing about a sudden structural failure, which would move much faster with far less warning.
How much warning time actually changes an outcome is not hypothetical: two real dam failures bracket the range. At Baldwin Hills, Los Angeles (1963), leaks were detected roughly three hours before the dam gave way; the resulting evacuation cut a potential death toll in the hundreds or low thousands down to just 5. At Ribadelago, Spain (1959), the Vega de Tera dam failed with essentially no warning; the flood wave hit the village at 108 km/h, and 144 of its 664 residents died, most within minutes. Mullaperiyar's own geography, 24–36 km of hilly terrain before reaching dense lowland population, plausibly offers more time than Ribadelago's 8 km straight shot into a valley town. Whether that translates into a Baldwin-Hills-style save depends entirely on the currently undocumented factors above: a real Emergency Action Plan, a functioning alert system, and public arrival-time data.
The honest bottom line
Mullaperiyar's downstream consequence rating is genuinely severe and maxes out every international dam hazard-classification system that exists, and that part isn't in dispute (see Safety). But the claim that it could become the single deadliest disaster in world history isn't supported by the hydraulic evidence, the population data, or the historical base rate for what dam disasters have ever actually produced. The real story, a severe potential consequence paired with an unusually poor evidence base, is the more accurate one, and arguably the more alarming.
Sources
- IIT Roorkee: "Dam Break Analysis," Vols. I–III, Project WRC-1022/11-12 (2012)
- Prof. T. Shivaji Rao: "Dam Break Report Confirms 35 Lakh Deaths Due to Collapse of Mullaperiyar" (2014)
- UNU-INWEH: "Ageing Water Storage Infrastructure: An Emerging Global Risk" (2021)
- Wikipedia: Banqiao Dam; 1975 Banqiao Dam failure; List of natural disasters by death toll
- Association of State Dam Safety Officials: Banqiao Dam case study
- Kerala State Disaster Management Authority: dam-management and reservoir pages
- Wikipedia: 2018 Kerala floods; Cochin International Airport; Eloor